Wants to know whether the AI investment is paying off: is adoption growing, where does usage sit and which models do the work.
Cost · Usage insights
Usage insights: see AI take hold
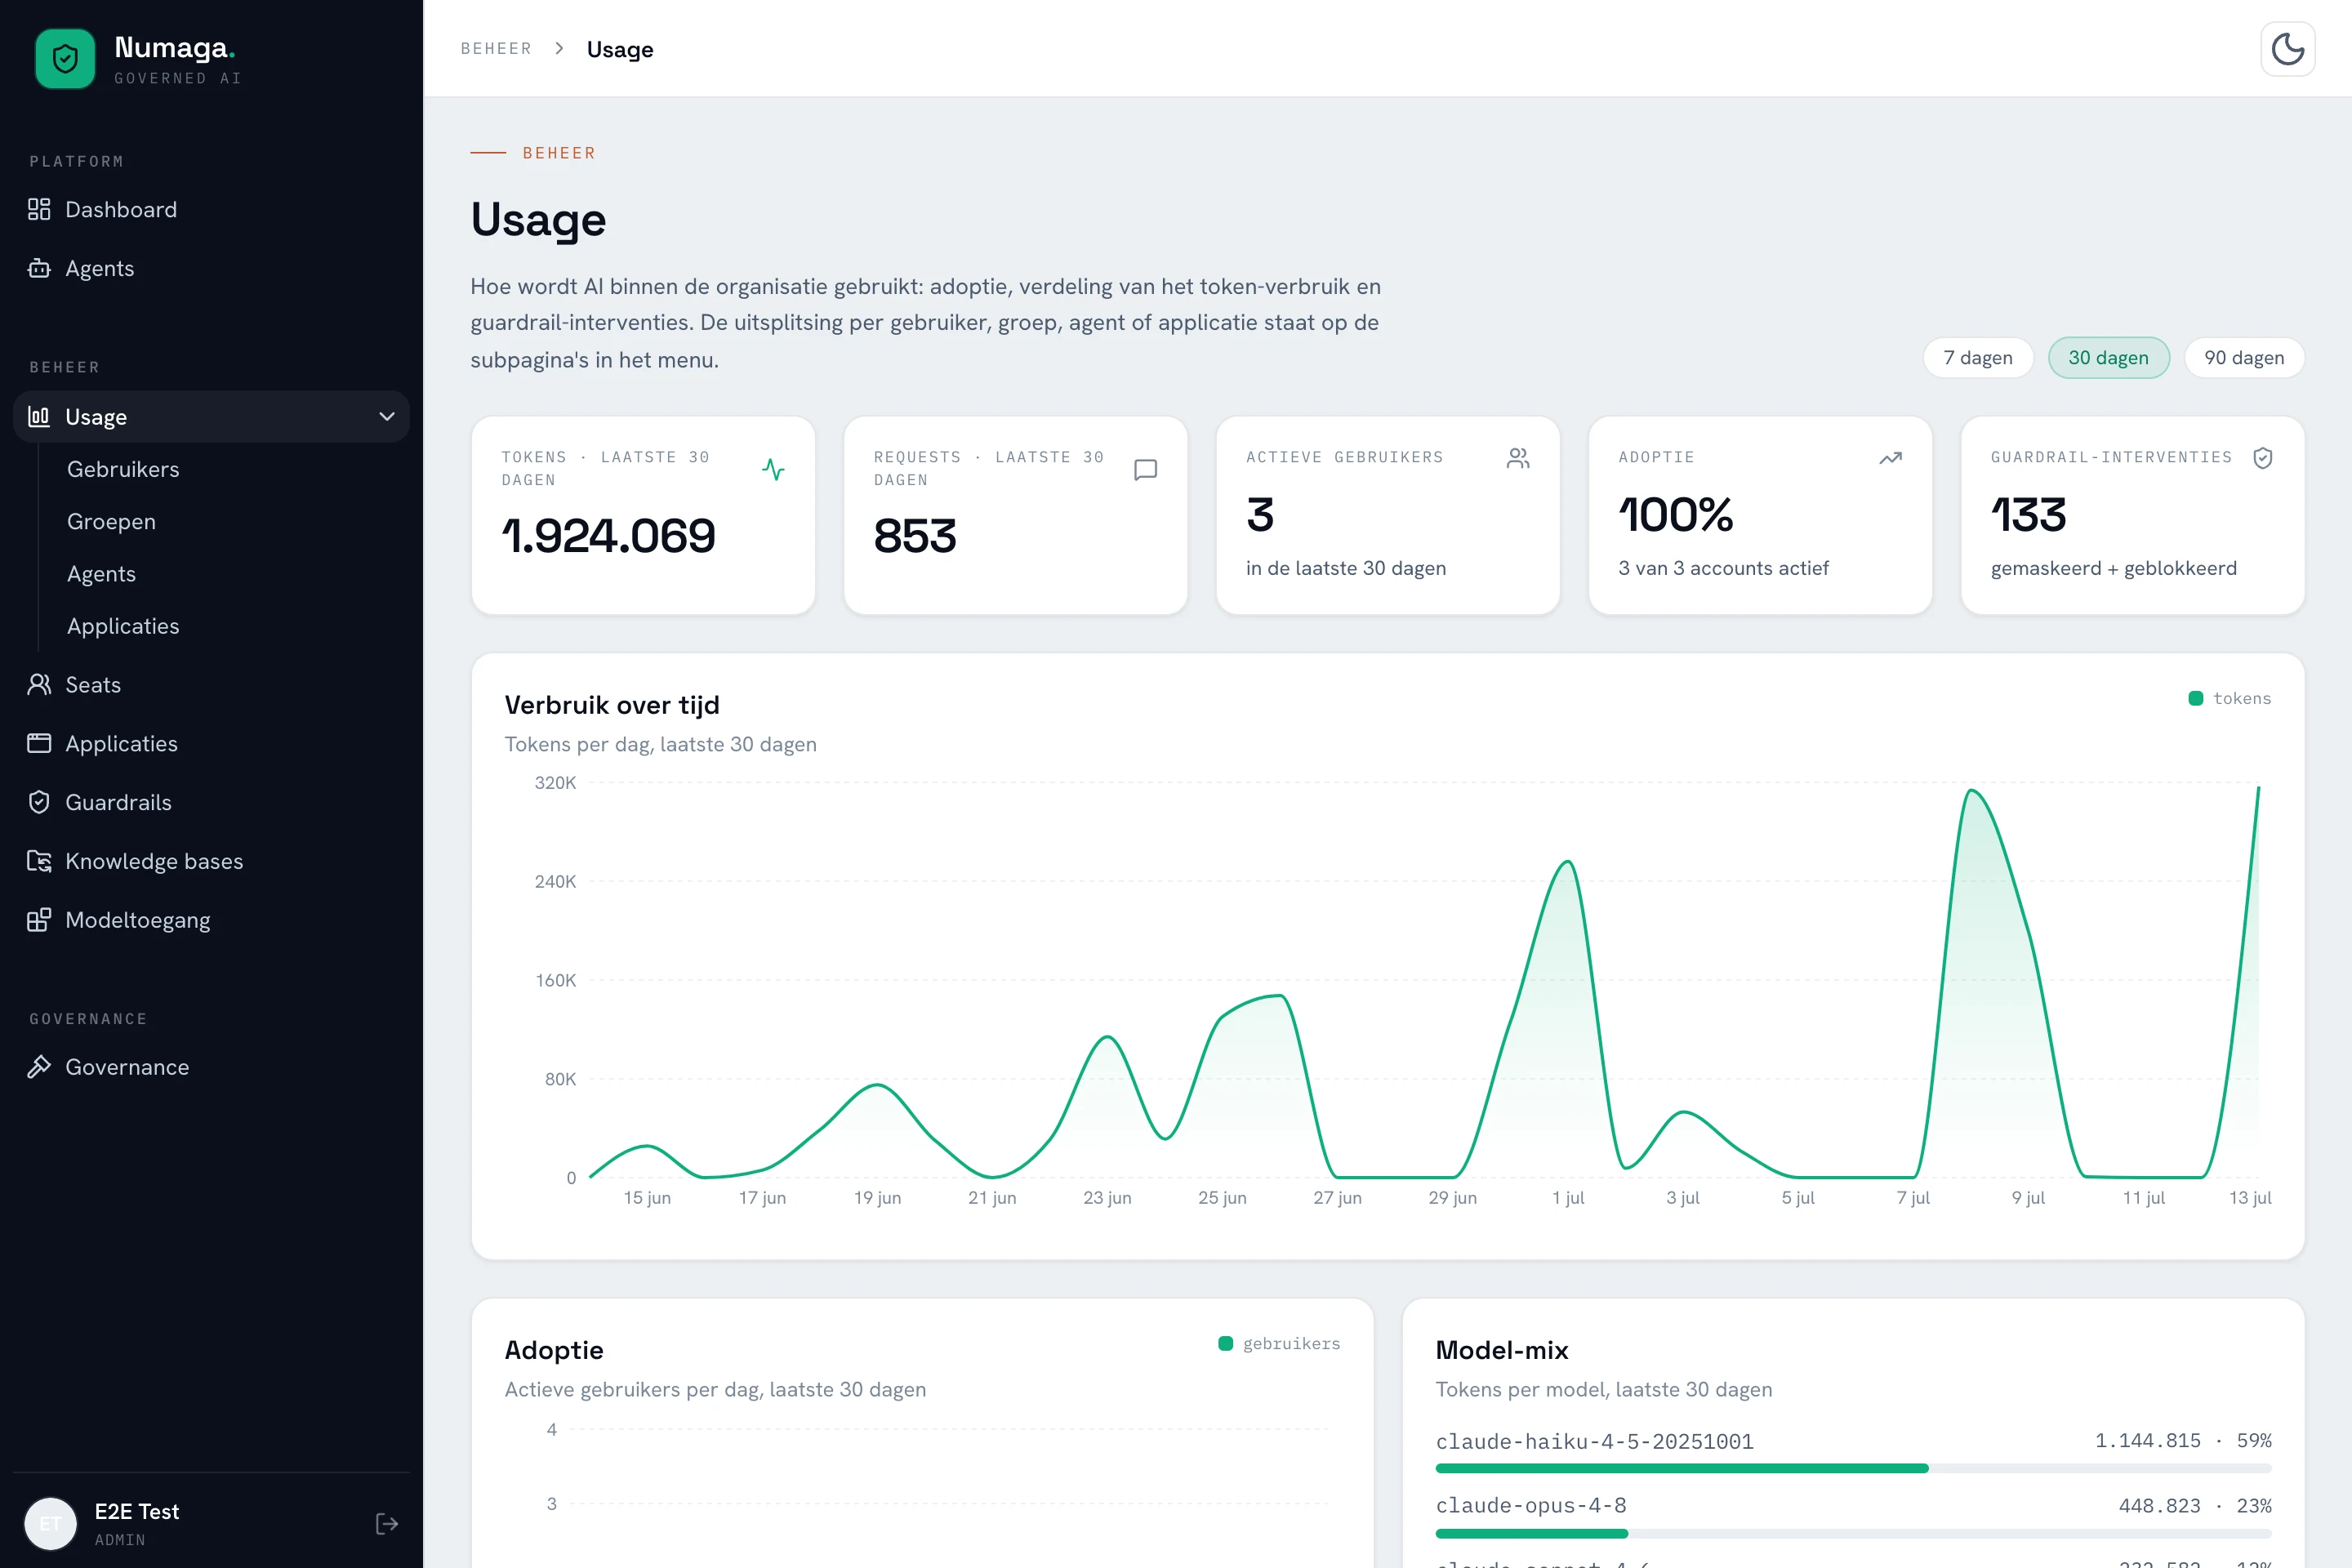
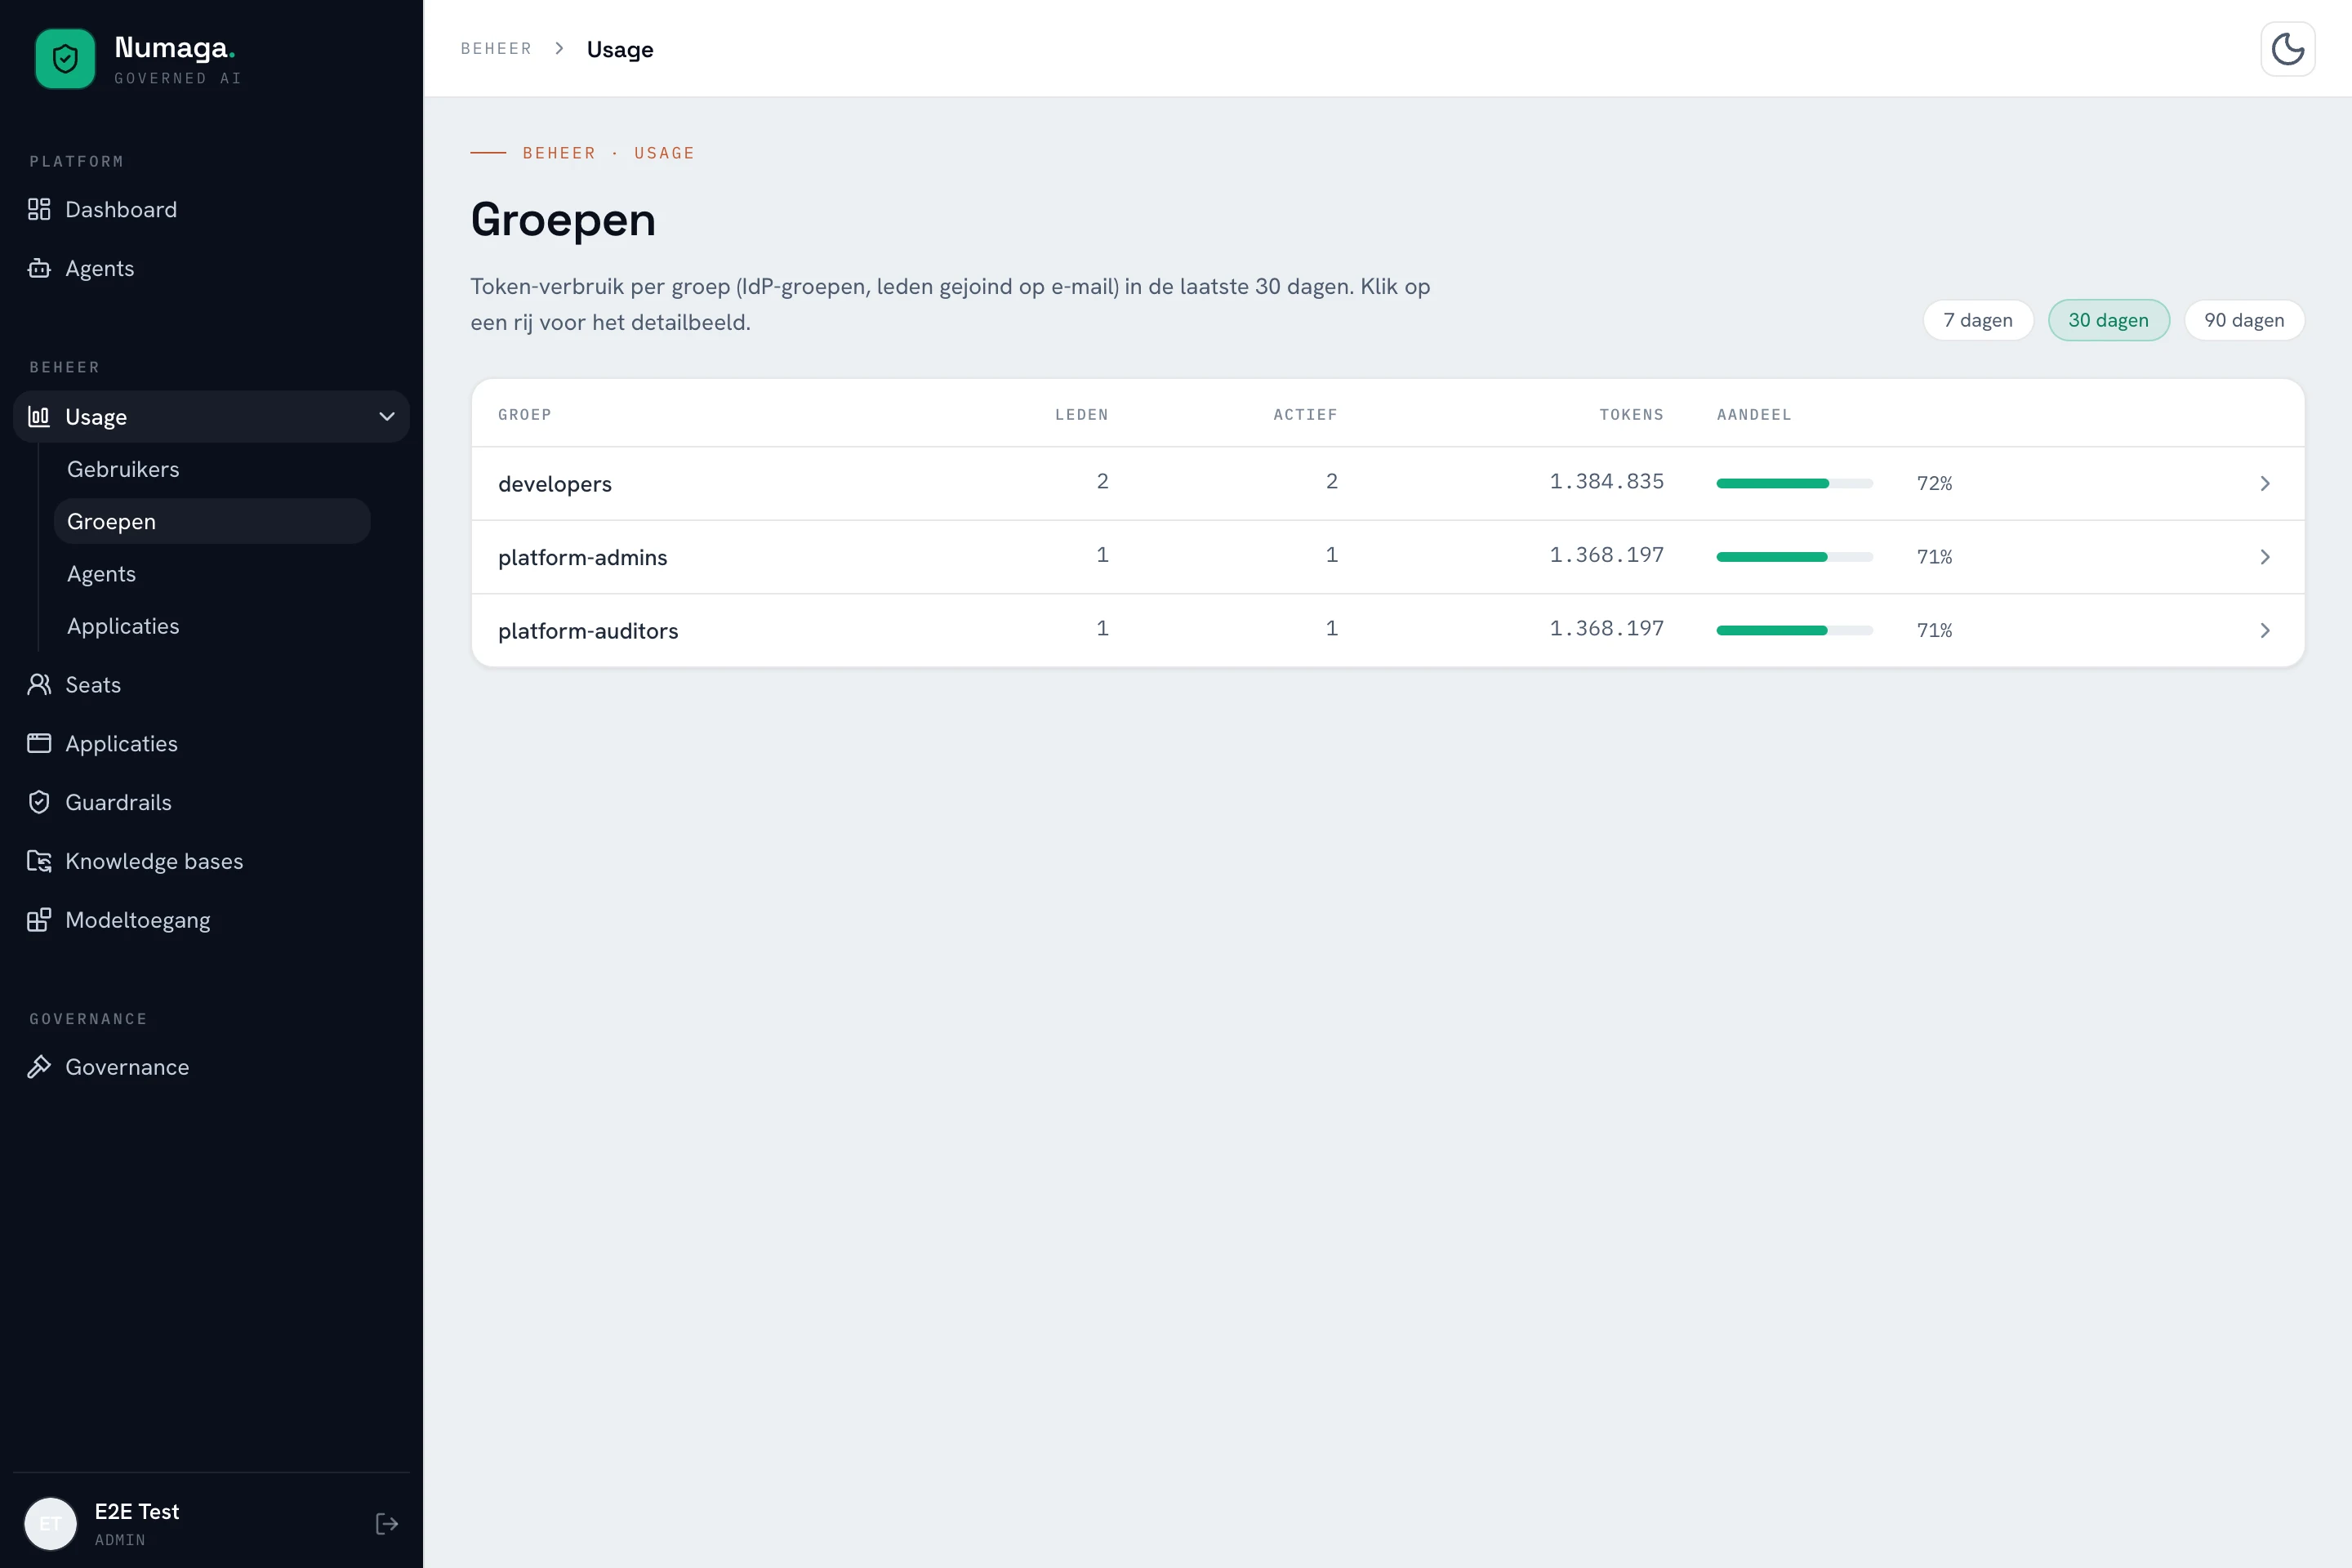
One overview of AI usage across your organisation: adoption, usage over time, the model mix and guardrail interventions. Click through to any user, group, agent or application for the detailed view, over the period you choose.
Who it’s for
Want to see how their teams pick up AI, per group from your own IdP, without asking for an export.
Want to see instantly which user, agent key or application sits behind a usage spike.
The problem
AI usage without insight is flying blind.
After the rollout, the questions start: is anyone actually using it? Which departments lead, which drop off? And where did that usage suddenly come from? Your provider’s invoice tells you after the fact, at the total level: exactly when it’s too late, and at exactly the wrong level of detail.
Numaga measures on the control plane, where every AI call passes through. So you see adoption and usage in real time, broken down per user, group, agent and application, in the same dashboard where you manage your policy.
How it works
From organisation view to one-click detail.
Adoption, distribution, drill-down and safety, over 7, 30 or 90 days.
Adoption at a glance
Active users per day and the adoption rate across your organisation: you see whether AI takes hold, not just whether it’s switched on.
Usage and model mix
Token usage over time and the distribution across models: see where the work happens and where the most expensive model runs unnecessarily.
Drill-down per angle
Users, groups from your IdP, agents and applications: every row clicks through to a detailed view with its own trend, model mix and recent requests.
Safety in the same picture
Guardrail interventions count in the same overview, with a click-through to the governance console for the full risk picture.
In practice
Proven where data is most sensitive.
Numaga is running a pilot with Ontdek Zorg, a home-care organisation in Gelderland. Healthcare, with special-category personal data under the GDPR, is where responsible AI is hardest. That is exactly where we put the control plane to the test.

- Home care in Gelderland
- Special-category data (GDPR Art. 9)
- Policy and redaction on every prompt
See how AI takes hold across your organisation.
We’ll show the usage overview live, from your own angles: users, groups, agents and applications.
Request demo access